
Model watch: weather models and outlooks, explained
This page shows the latest official NOAA outlooks for the tropics, severe storms, flooding and the next two weeks, and explains in plain English what they mean and how much to trust them the further out they look.
Forecasts change; follow your local National Weather Service office. This page explains official outlooks. We don’t make our own forecasts.
Tropics: the next 7 days
The X marks are areas the National Hurricane Center is watching. The color is the chance a tropical depression or storm forms within 7 days: yellow is low (under 40 percent), orange is medium (40 to 60 percent), red is high (over 60 percent). The shading shows where it could form, not where it will go or who it will hit.
Once a storm forms, use the NHC advisory and cone on our storm pages. Spaghetti plots you see online show individual computer models, each with its own errors. The official NHC forecast weighs them all and is the one to plan around.
Severe storms
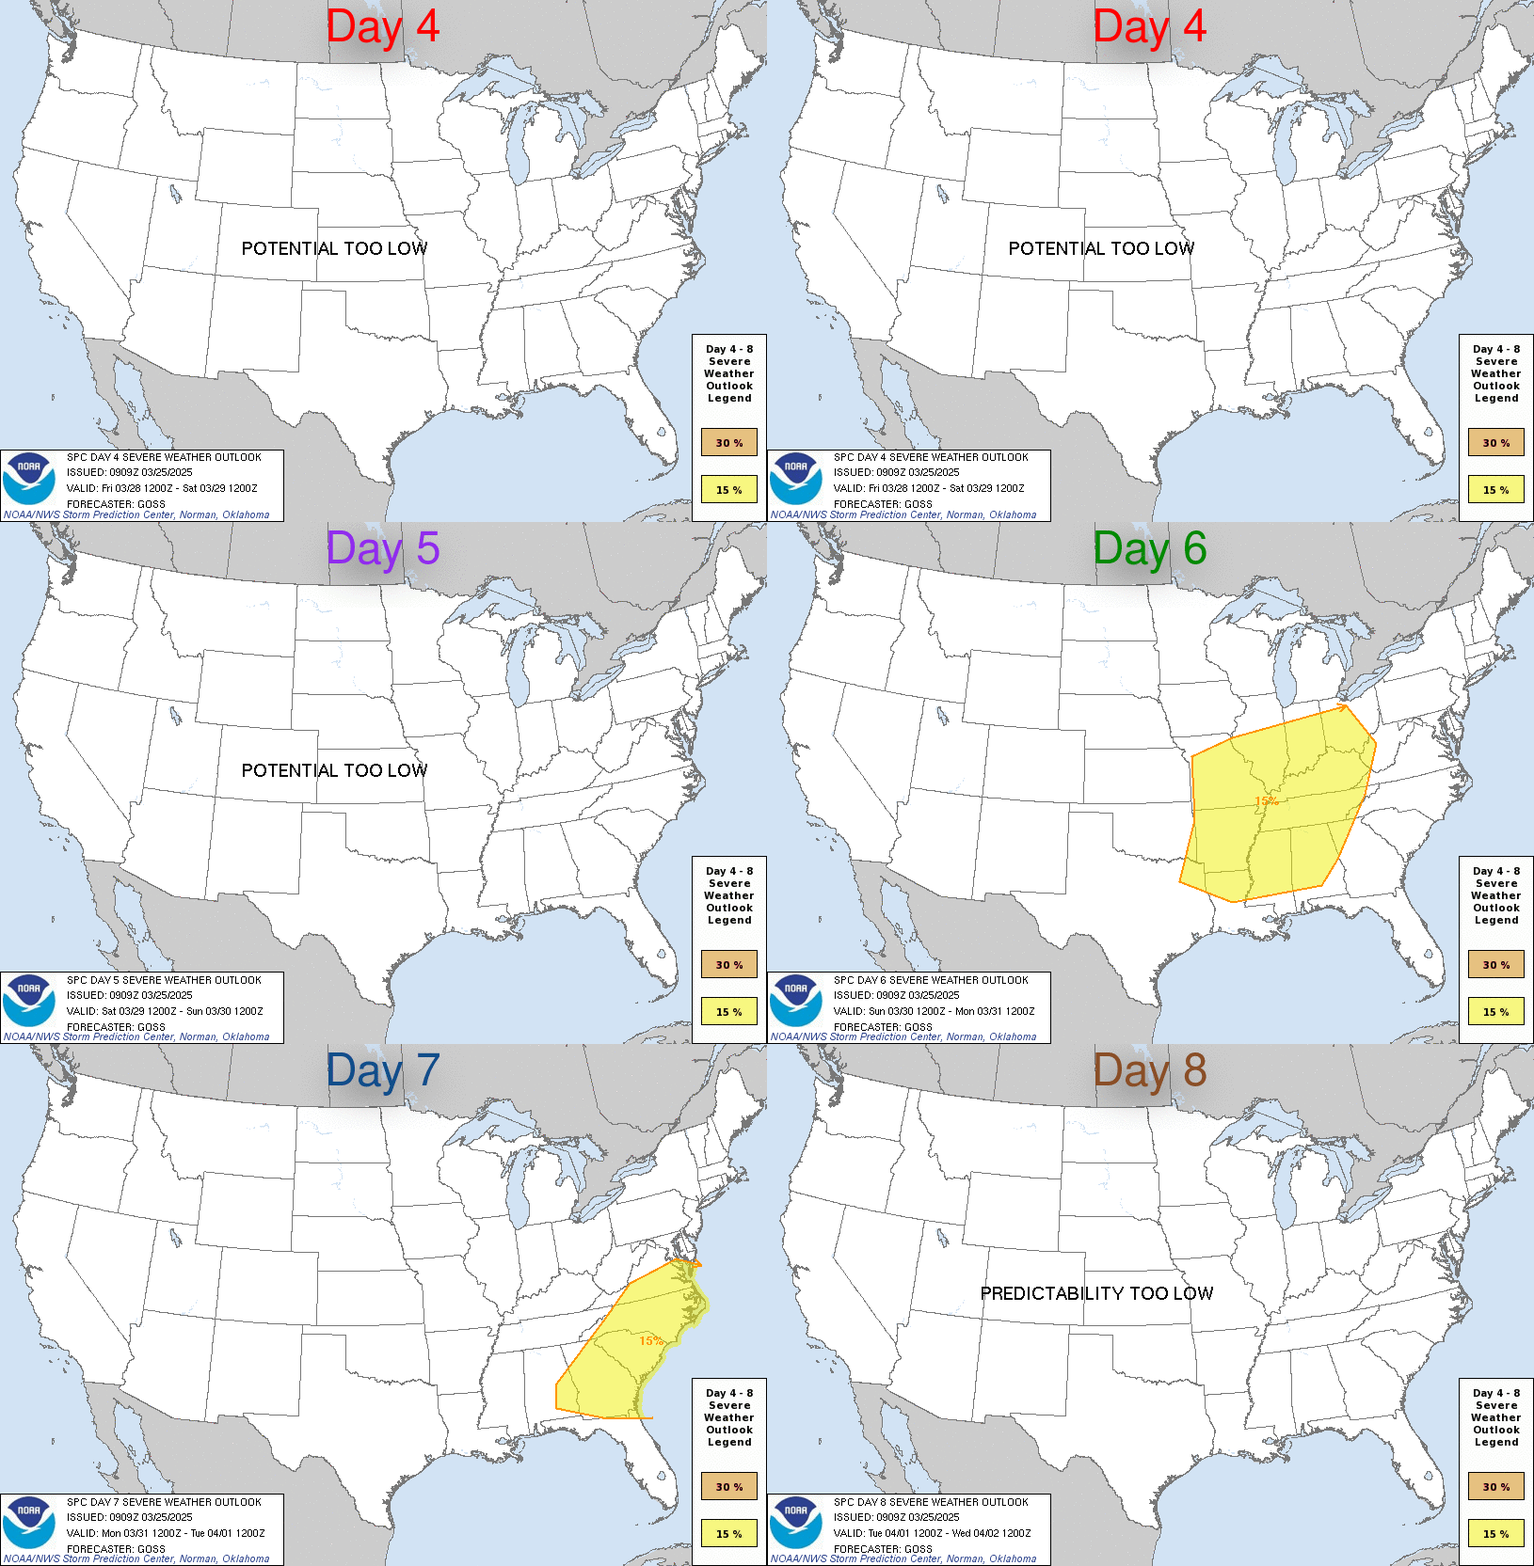
The Storm Prediction Center rates severe thunderstorm risk on five levels: 1 Marginal, 2 Slight, 3 Enhanced, 4 Moderate and 5 High. Even a level 1 or 2 day can bring a tornado or damaging wind somewhere in the shaded area. Higher levels mean more storms, stronger storms, or both.

Rain and flash flooding
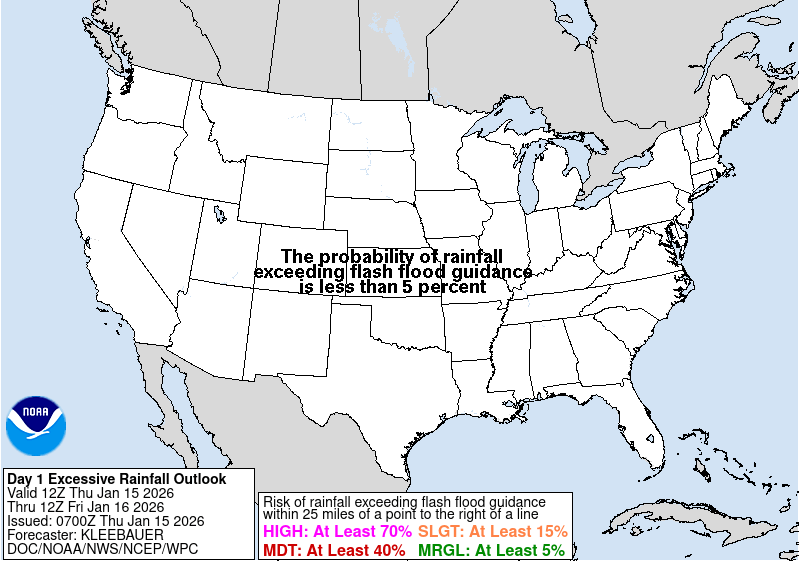
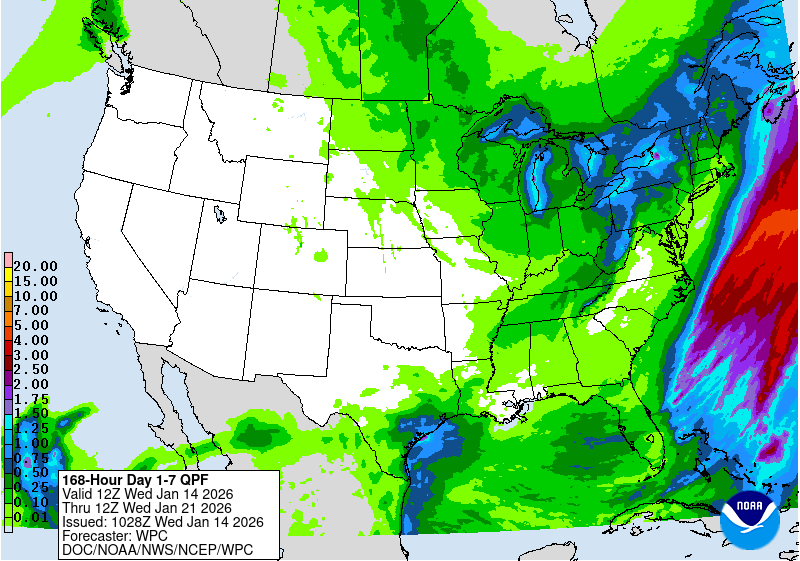
The Weather Prediction Center’s Excessive Rainfall Outlook uses four levels: 1 Marginal, 2 Slight, 3 Moderate and 4 High. Most flood deaths happen in vehicles, so on a level 3 or 4 day, plan routes that avoid low spots. The 7-day rain total map shows how much rain is expected in all, not when it falls.
The next two weeks
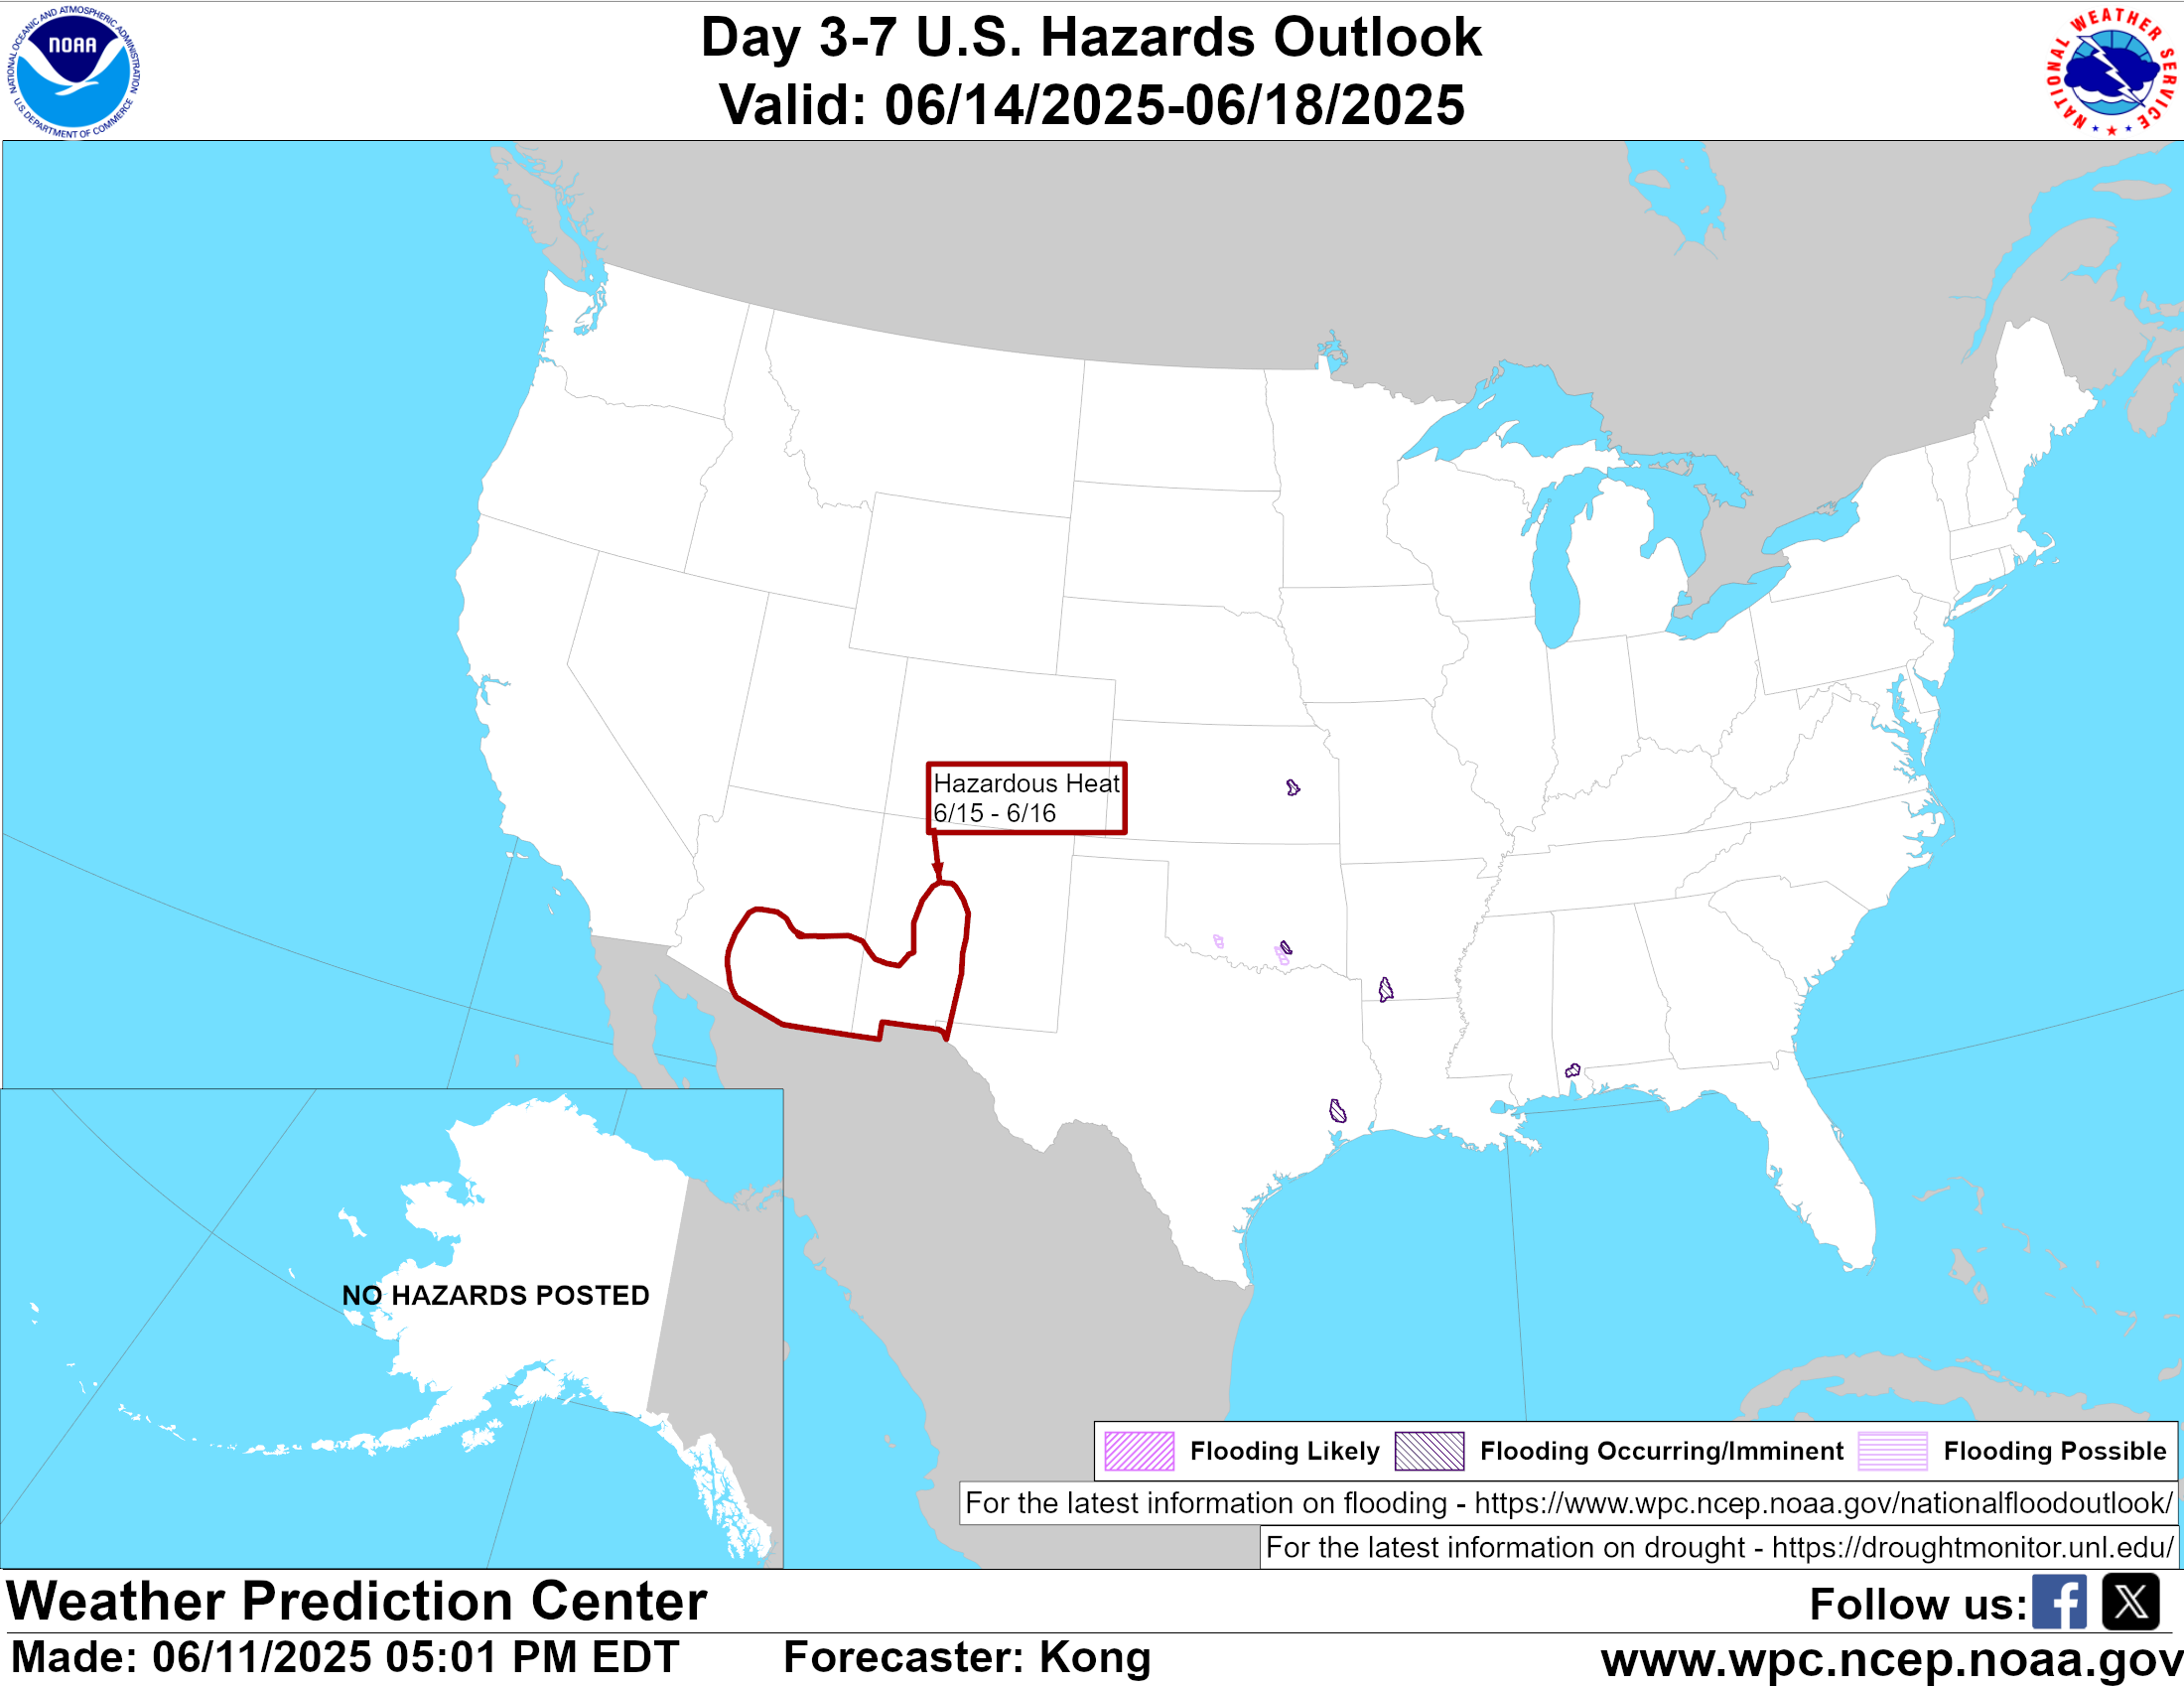
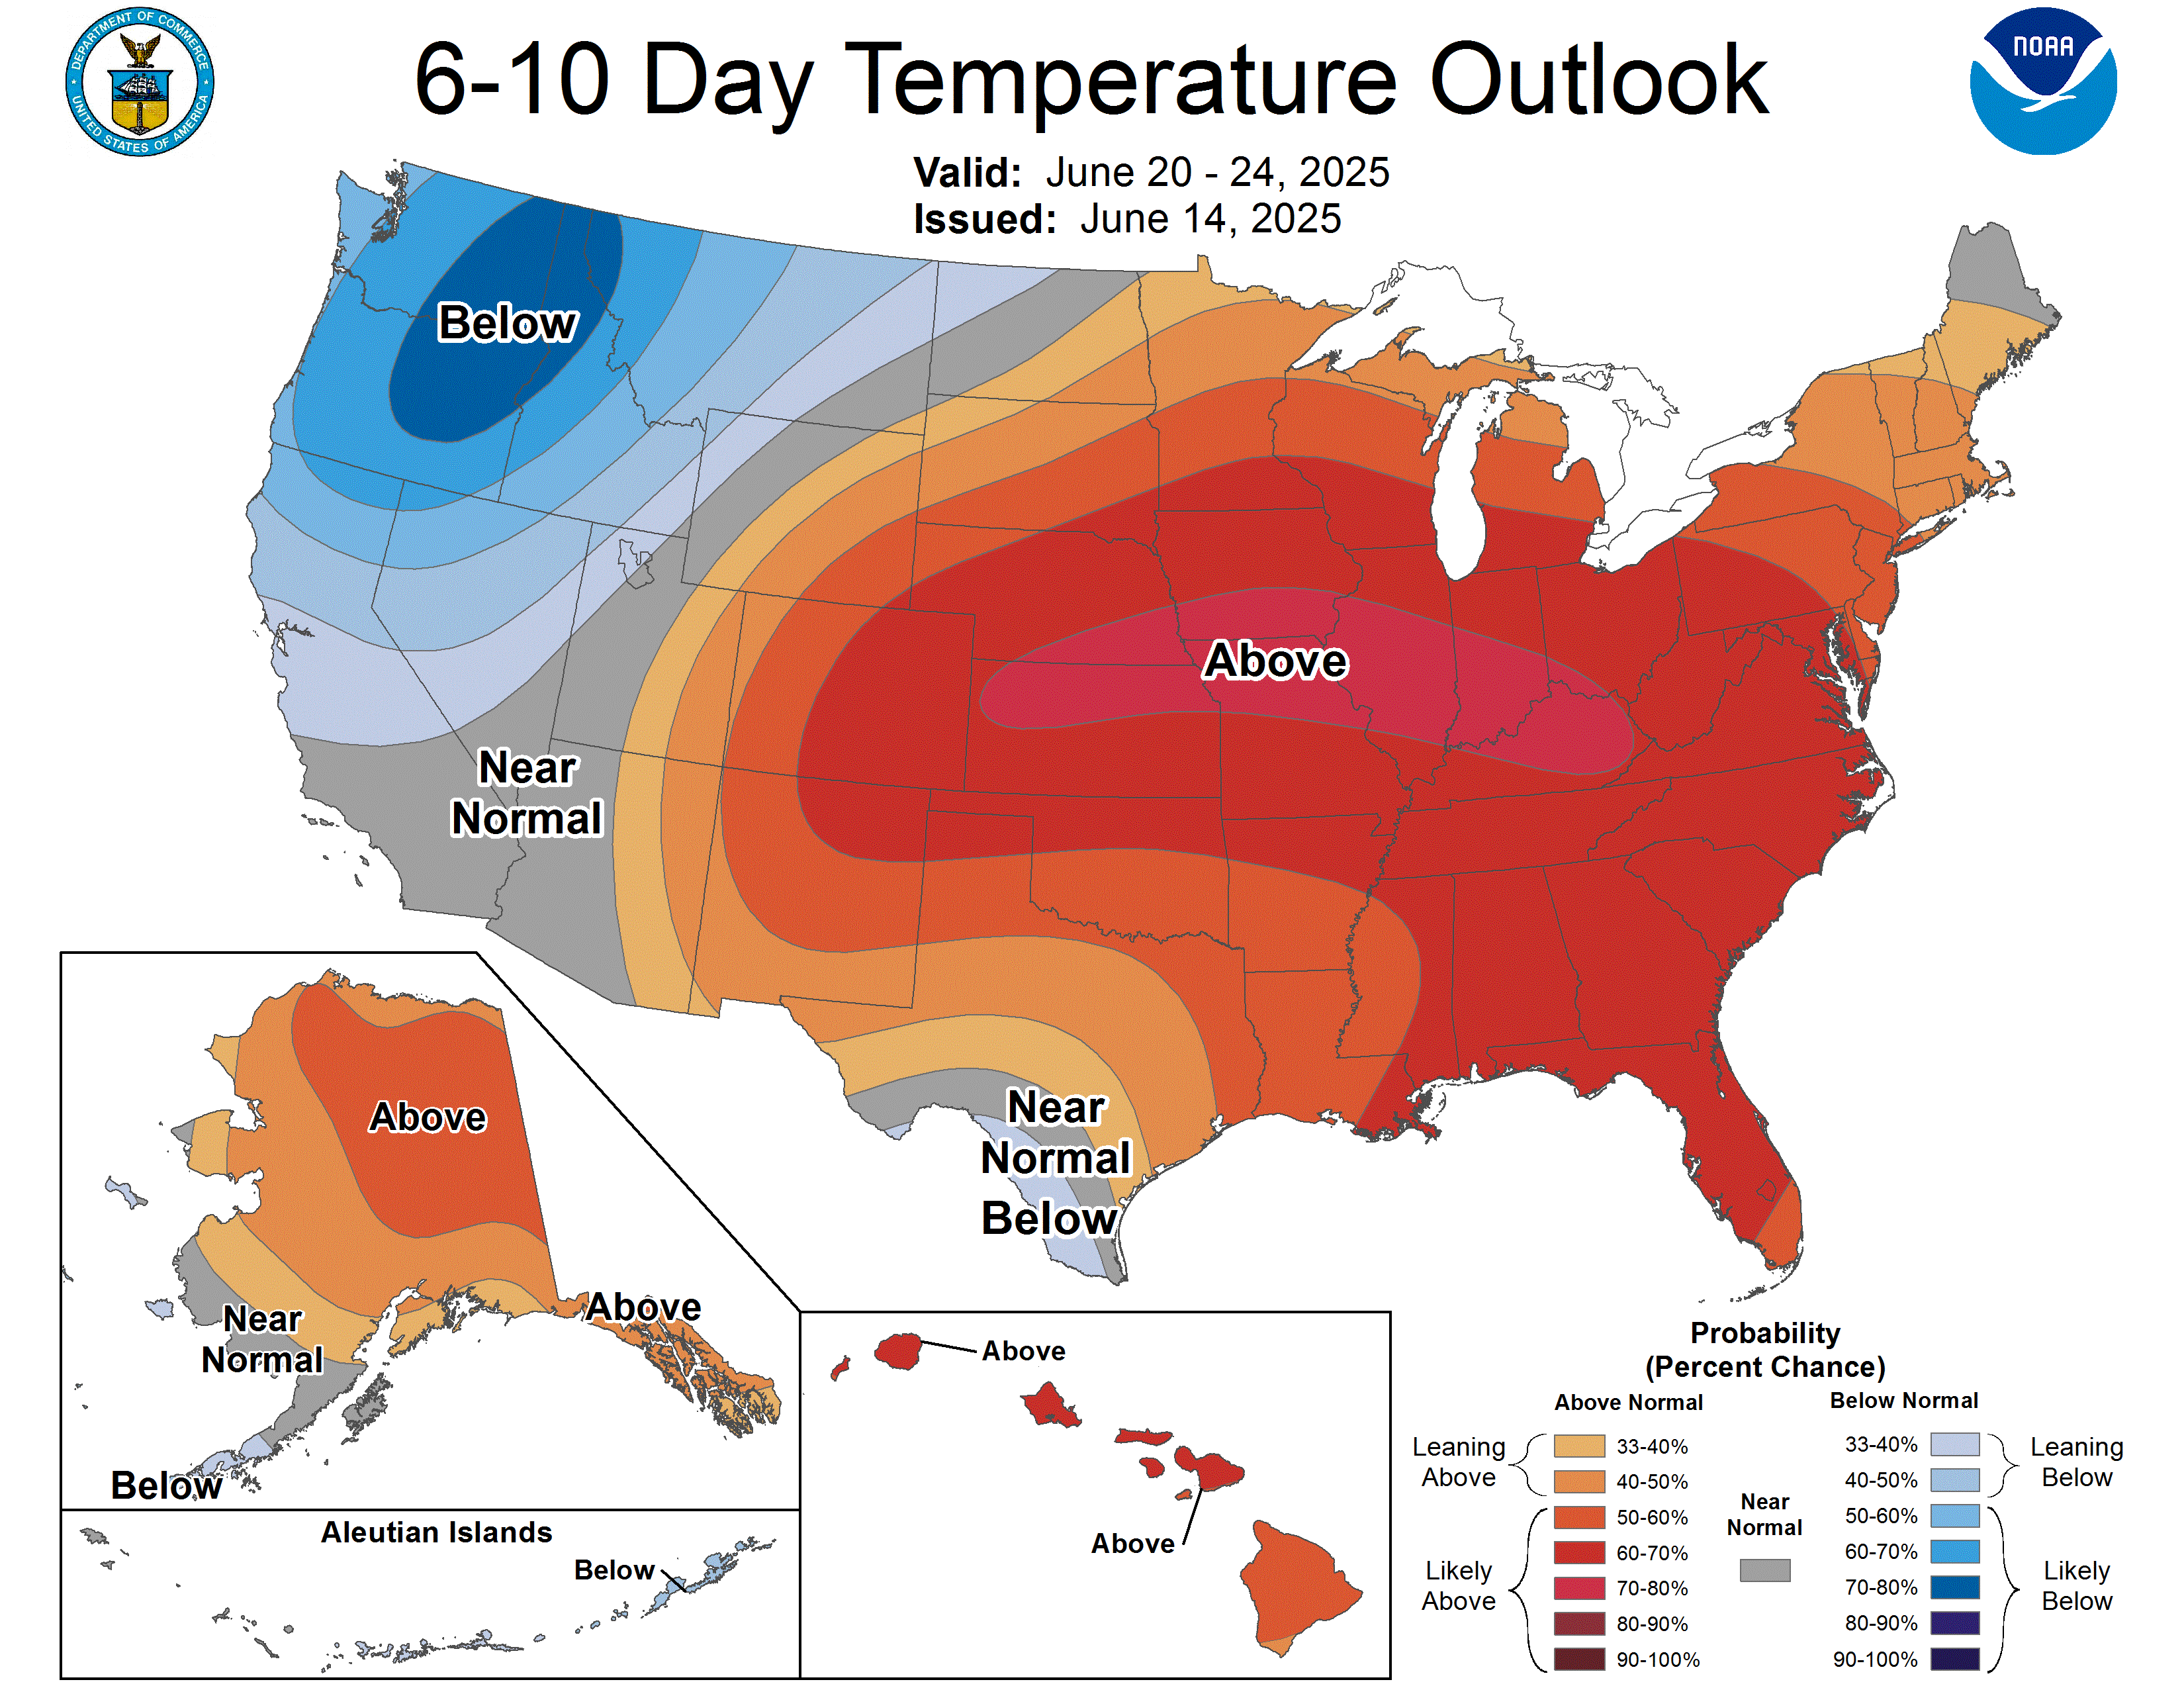
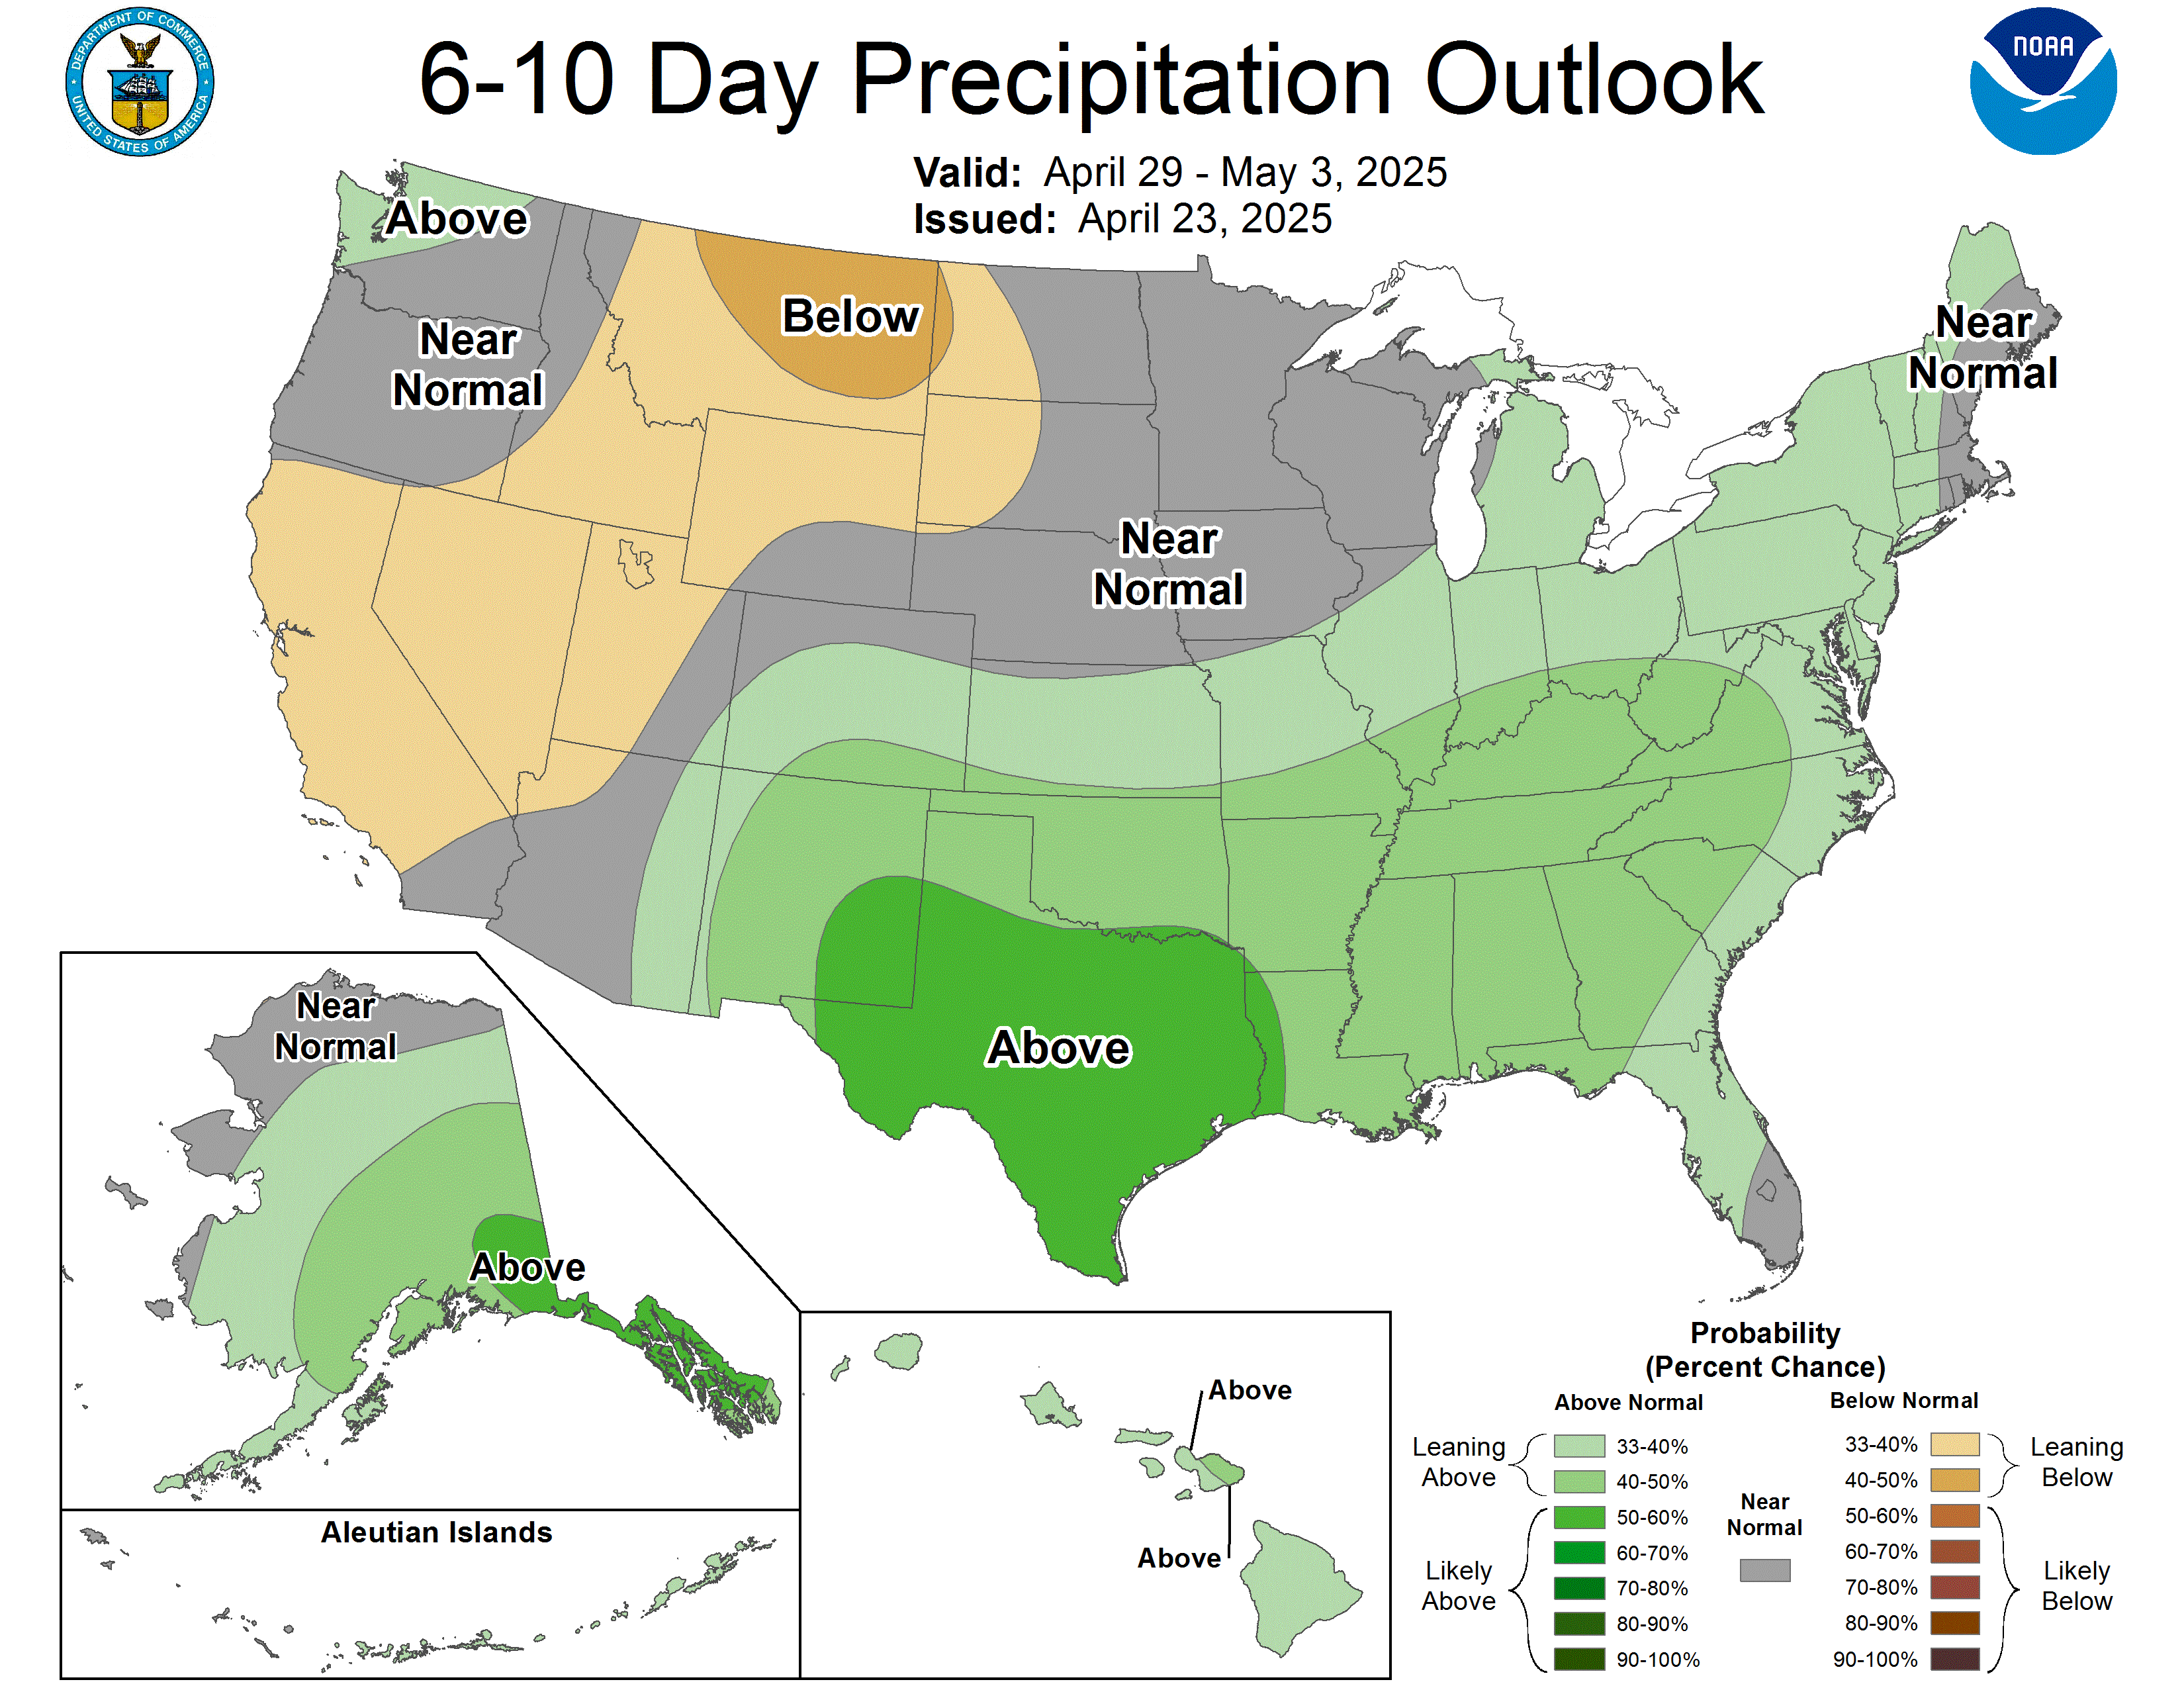
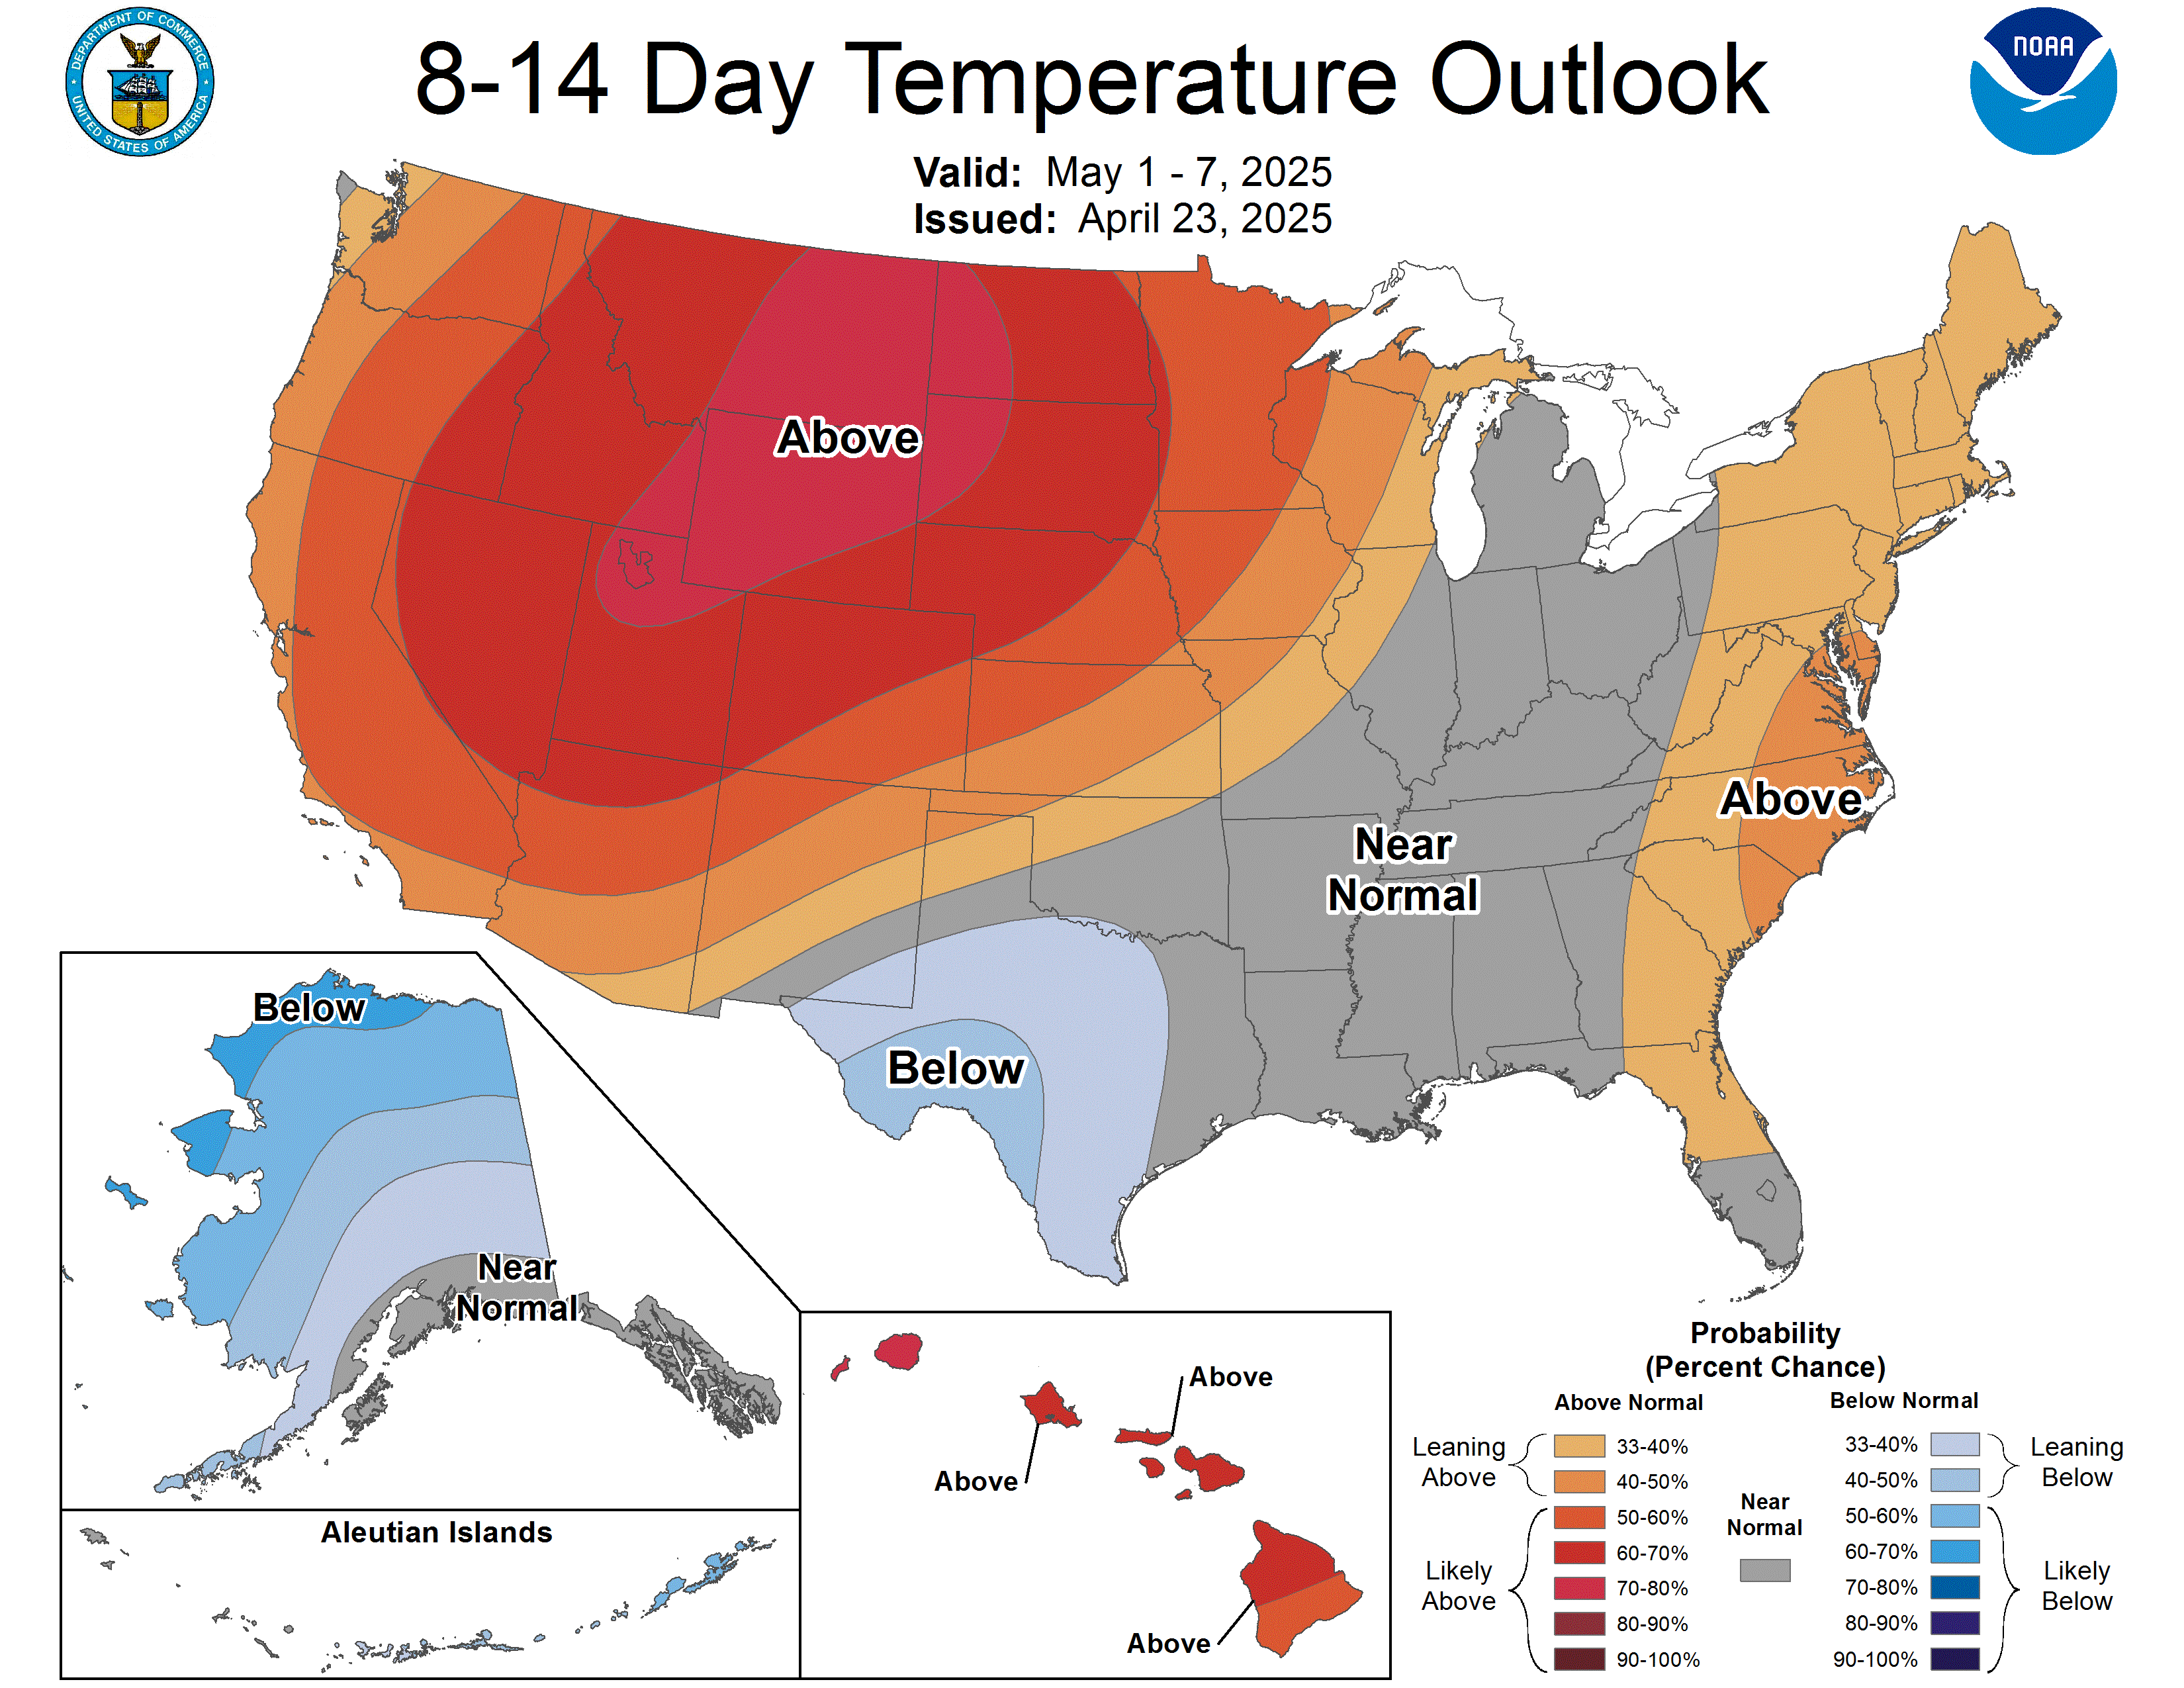
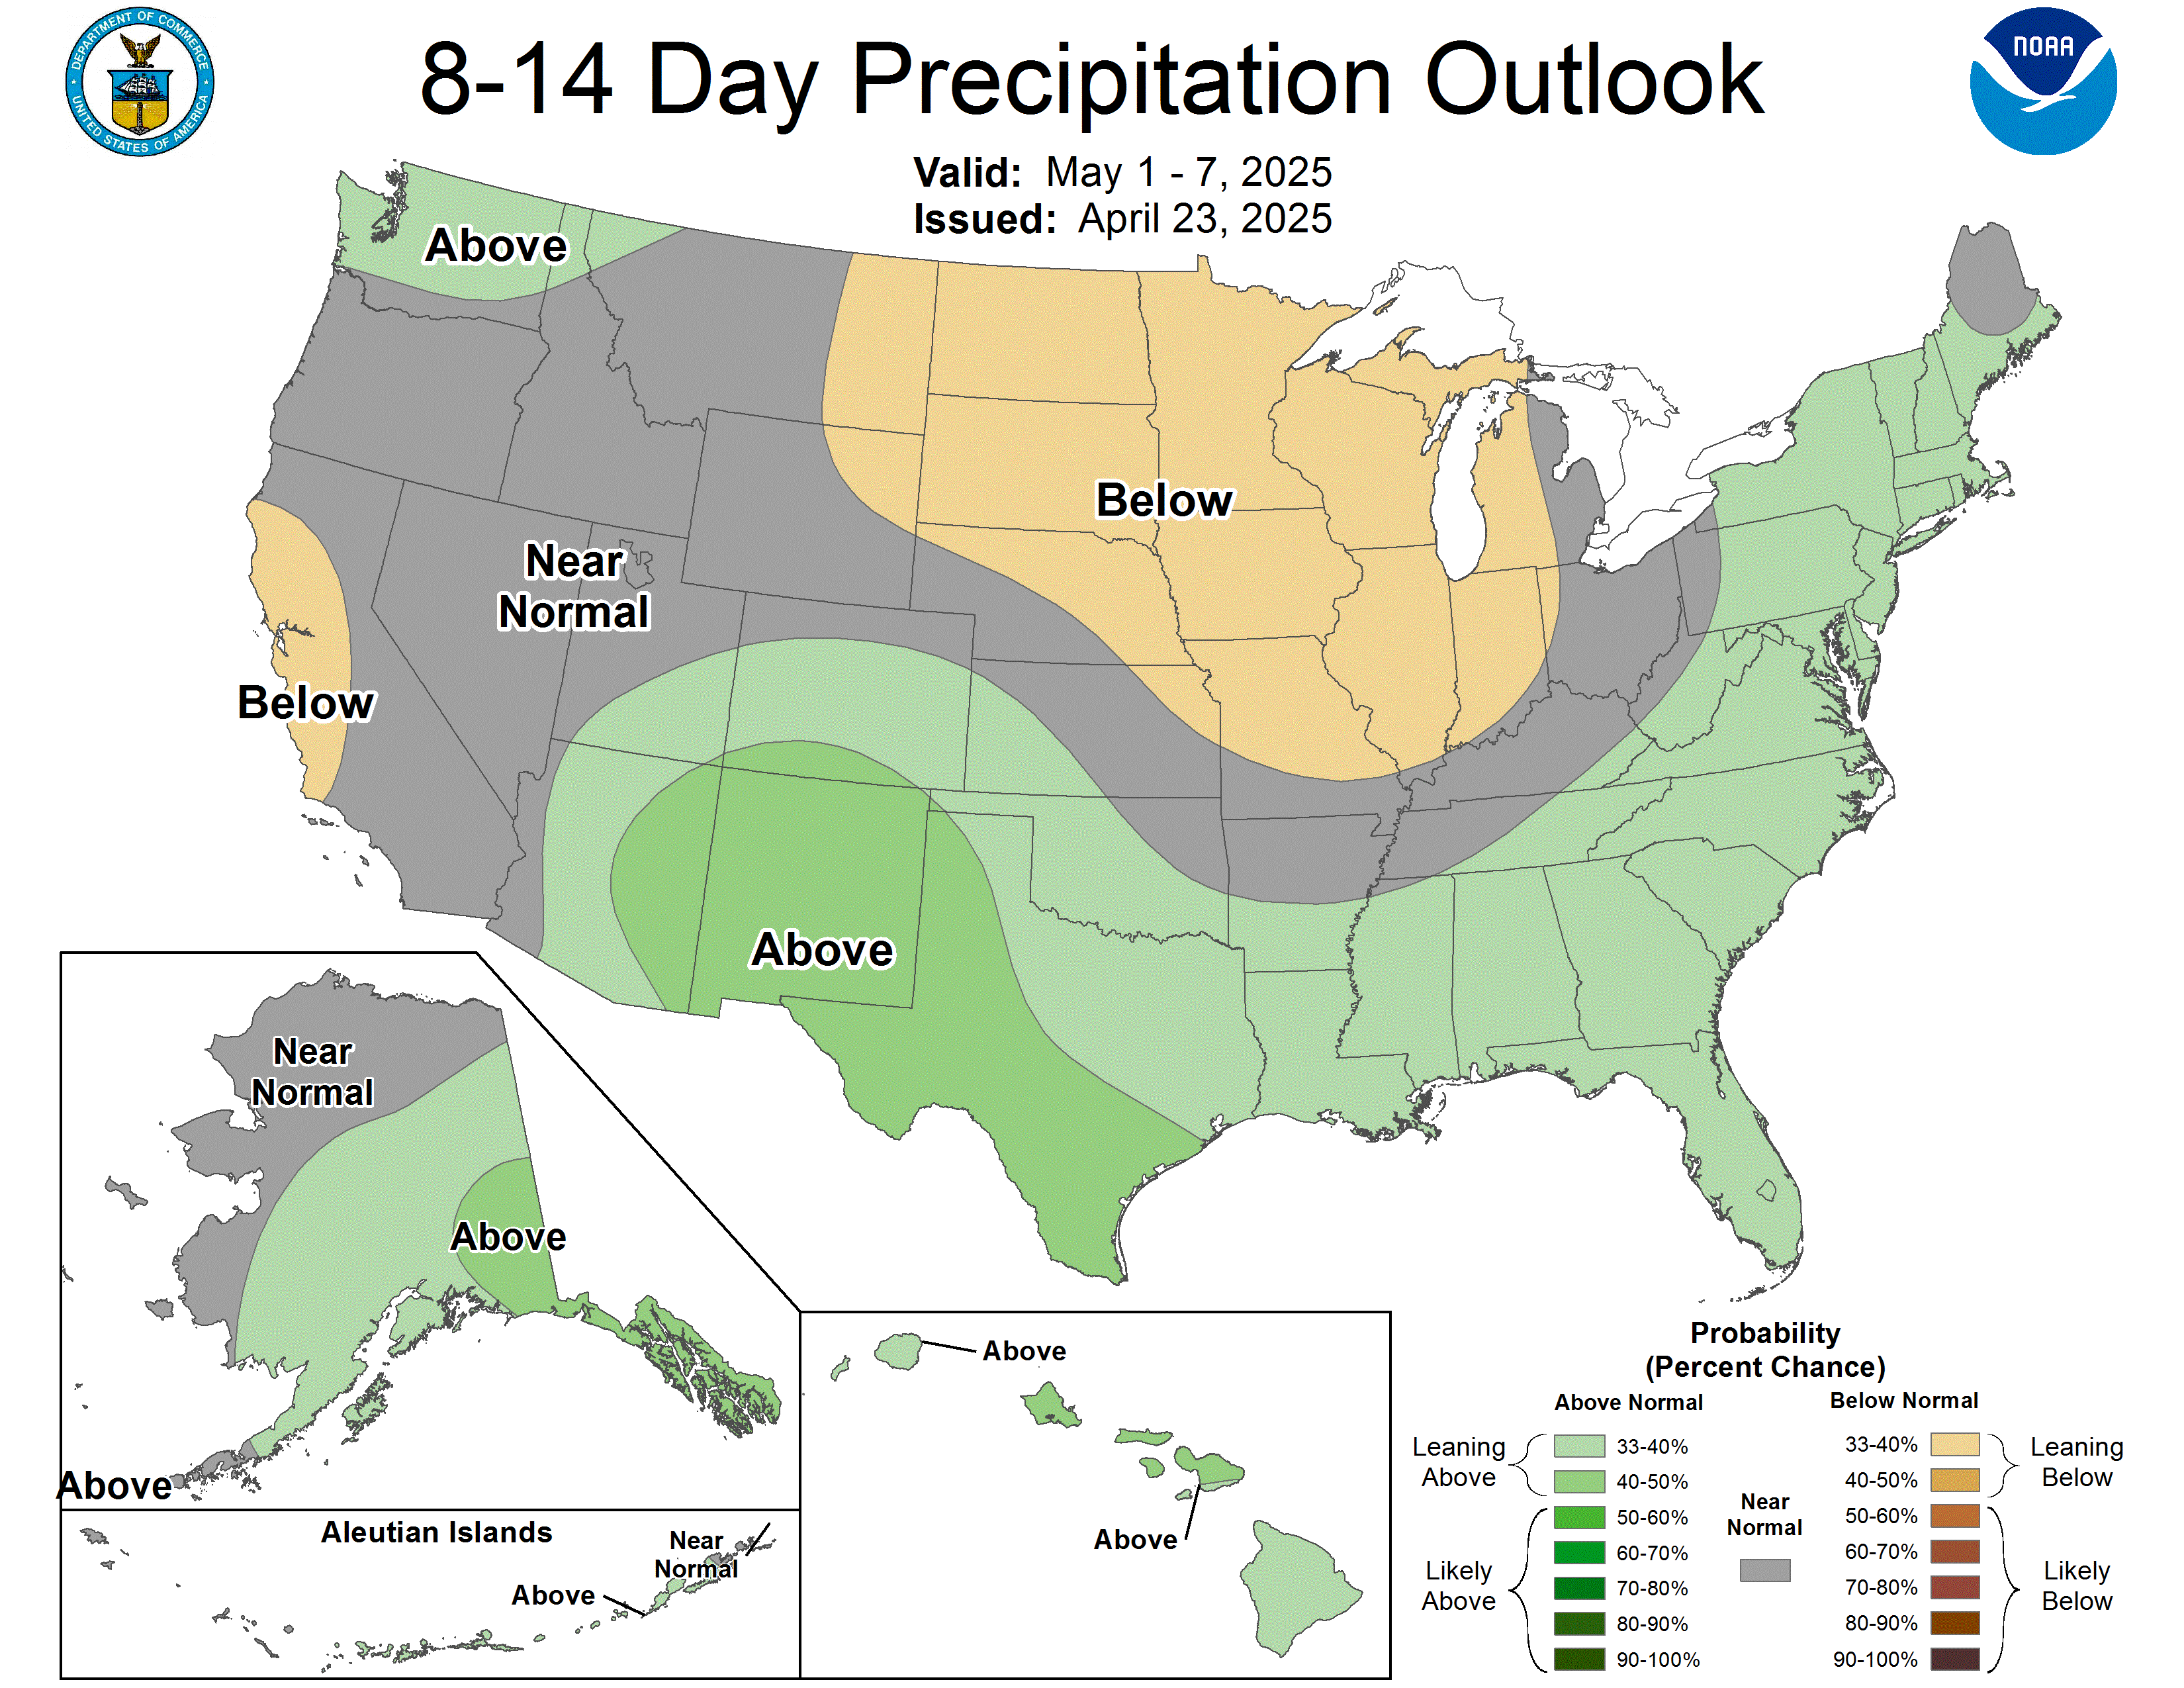
The Climate Prediction Center’s 6–10 and 8–14 day outlooks don’t forecast storms. They show the odds that temperature or precipitation will be above or below normal for the period. Darker colors mean higher odds, not more extreme weather. “Near normal” or white areas mean no clear lean either way.
How much to trust it this far out
Forecasts get less precise the further ahead they look. That isn’t a flaw in any one model; the atmosphere is chaotic, and small errors today grow over time. A rough guide:
| How far out | What you can count on | What to do |
|---|---|---|
| Today to 3 days | Timing, rough location and type of threat. Watches and warnings come in this window. | Act on your local NWS forecast and warnings. |
| 4 to 7 days | That something may happen and the general region. Exact track, totals and timing still shift. | Check your supplies and plans. Don’t cancel anything yet. |
| 8 to 14 days | Only tilts in the odds: warmer or colder, wetter or drier than normal. Not individual storms. | Use for general planning only. |
| Beyond 2 weeks | Seasonal patterns, not day-to-day weather. | Ignore any post naming a storm date this far out. |
For hurricanes, the National Hurricane Center sizes its forecast cone so that about two-thirds of past forecast errors fall inside it. That means the center of a storm ends up outside the cone about one time in three, and impacts like rain, surge and wind often reach well beyond it. (NHC: Definition of the cone)
About the models
A weather model is a computer program that starts from current observations and calculates how the atmosphere will change. The ones you’ll hear about most:
- GFS (Global Forecast System): the U.S. global model, run by NOAA four times a day.
- European model (ECMWF): a global model run by a European agency.
- Ensembles: the same model run many times with slightly different starting conditions. When the runs agree, confidence is higher. When they spread out, the forecast is uncertain.
- Short-range models (like the HRRR): cover hours to a couple of days in more detail, useful for thunderstorms.
One model run showing a monster storm 10 days out is not a forecast. Look for agreement across runs and across models, and for the official outlooks above, which forecasters build from all of them. You can browse NOAA’s own model maps at NOAA Model Analyses and Guidance.
Where to go next
- Storms to watchLive official outlooks with issue times
- Active weather eventsTornado, flood, winter, heat and smoke pages
- Before a hurricanePrep checklist
All graphics on this page are U.S. government works from NOAA’s National Hurricane Center, Storm Prediction Center, Weather Prediction Center and Climate Prediction Center, shown as published and linked to the original. Storm Recovery Hub is not a government agency.
Common questions
How far out can weather be forecast?
Day-to-day details are most reliable within about 3 days. From 4 to 7 days, forecasts show that something may happen and roughly where. From 8 to 14 days, NOAA’s outlooks only show whether it leans warmer, colder, wetter or drier than normal.
What is a spaghetti model?
A map with many lines, each showing one computer model’s idea of where a storm’s center will go. The spread shows uncertainty. The official National Hurricane Center forecast weighs all of them and is the one to plan around.
Does the hurricane cone show where damage will happen?
No. The cone shows where the center of the storm will probably go; NHC sizes it so about two-thirds of past forecast errors fall inside. Rain, surge and wind often reach far outside the cone.
What do the CPC 6-10 and 8-14 day outlooks mean?
They show the chance that temperature or precipitation will be above or below normal over that period. Darker colors mean higher odds of leaning that way, not more extreme weather.